Operating Node.js in Kubernetes at scale at BlaBlaCar
At BlaBlaCar, there is a dedicated team of frontend engineers in charge of the user-facing web application. This frontend team… is also a backend team.
Every BlaBlaCar web user consumes a web application. It’s a Single Page Application (SPA) based on Typescript and React. Alongside this SPA, the frontend team also owns the Node.js service used for Server-Side Rendering (SSR).
Why do we need SSR? When a user asks for a web page, we want to return this page fully rendered for both performance and SEO reasons. We don’t want the user, or a crawler, to receive an empty SPA skeleton without any content included yet.
But operating this Node.js server at scale in a Kubernetes cluster is not as trivial as it might look, especially for a team without previous infrastructure background. We had to understand deeply how Node.js works under the hood, measure how our server behaves with traffic and… learn Kubernetes. Such a big topic when the day to day job is about writing new UI components!
Let’s look at the challenges we have overcome in the past few months. We will show how we use CPU and memory metrics and other Kubernetes options to configure how we scale Node.js. This article assumes the reader has basic knowledge about Kubernetes or similar container orchestration tools.
Scaling when needed
All web traffic targeting our SPA goes through our Node.js server. We need to adapt the resources that support the service to match how much traffic we have to serve.
We’re scaling horizontally to handle more or less traffic. Like the majority of microservices, we add more Pods when traffic goes up. We remove some Pods when traffic goes down. Each Pod contains its own Container of our Node.js server. It serves part of the web traffic directed to the application in the cluster.
Scaling on CPU
The point in this setup is to know when we need to scale up and down. It’s not a surprise that we have to monitor the CPU for that as it indicates how much we use the Pod.
When the average CPU on all Pods exceeds a certain threshold, we add more Pods. When the CPU goes down, we remove Pods. This allows us to only use resources when needed. We don’t want to pay for 20 Pods when only 5 would be enough.
The Horizontal Pod Autoscaler (HPA) controls this scaling. Let’s say our HPA config is this one:
// hpa.yml
apiVersion: autoscaling/v2beta2
kind: HorizontalPodAutoscaler
metadata:
  name: spa-service
  labels:
    app: spa-service
spec:
  scaleTargetRef:
    apiVersion: apps/v1
    kind: Deployment
    name: spa-service
  minReplicas: 4
  maxReplicas: 30
  metrics:
    - type: Resource
      resource:
        name: cpu
        target:
          type: Utilization
          averageUtilization: 70
And our Deployment config is the following:
// deployment.yml
apiVersion: apps/v1
kind: Deployment
metadata:
  name: spa-service
  labels:
    app: spa-service
selector:
  matchLabels:
    app: spa-service
template:
  metadata:
    labels:
      app: spa-service
  spec:
    containers:
    - name: spa
      image: spa
      resources:
        limits:
          cpu: 700m
          memory: 450Mi
        requests:
          cpu: 600m
          memory: 320Mi
Kubernetes instructs the workload resource to scale up when we reach
averageUtilization. In our situation it means the Deployment will scale up when
the average CPU reaches the target of 70% of the requested CPU value. The
Deployment scales down when the metric is below the target.
We chose resources limits and requests values after multiple iterations. The smaller the values, the smaller the Pods are. With small Pods, we need more replicas to handle the load than with bigger ones. We observed a clear overhead on the memory side because of Node.js loading the service’s code in memory. This limits how small a Pod can be.
In our example, we never go below 4 or above 30 Pods. Why 4 and not 1 or 2? This
allows us to be sure we always have some servers running, on different Nodes.
The maxReplicas helps us staying in control of the scaling. We don’t want to
discover that the service scaled to hundreds of Pods for an unknown reason
during the night without being paged first.
This basic setup was a good first step to operate our service on the cluster without too much issue. There were parameters we had to carefully choose here, by classic trial and error. The main one is of course the CPU target percentage. We don’t want it to be too low to not provision unused resources, but not either so high that scaling happens too late or that we end up in a noisy neighbor situation. 70% works well for us.
When CPU is not enough
Our CPU-based HPA worked great until a calm and sunny Saturday afternoon a few months ago. A random credential-stuffing attack targeting BlaBlaCar started. It soon generated a lot of traffic and overloaded our Pods.
Such an attack is usually not a big deal for us. We have the security tools and the scaling in place to mitigate the potential impact for our users. It should not even require any human action. But this time the traffic received by our Node.js servers doubled in less than 30 seconds. Pods were overloaded and unable to handle the traffic, and our HPA started scaling down our Deployment! Why?
Back to school
CPU is not the only metric to have in mind when operating code. Memory is here too. We may have learned in engineering school how the two are actually like the two sides of the same coin.
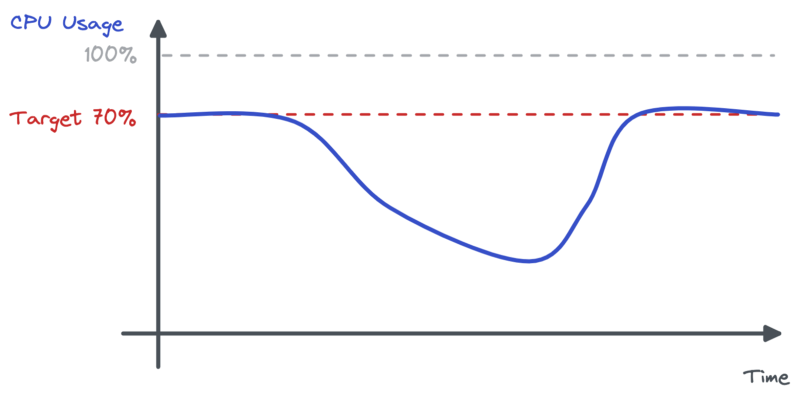
During the incident the CPU usage dropped significantly. This justifies the HPA asking the workload to scale down.
In the meantime, memory usage for Pods was significantly more important than usual.
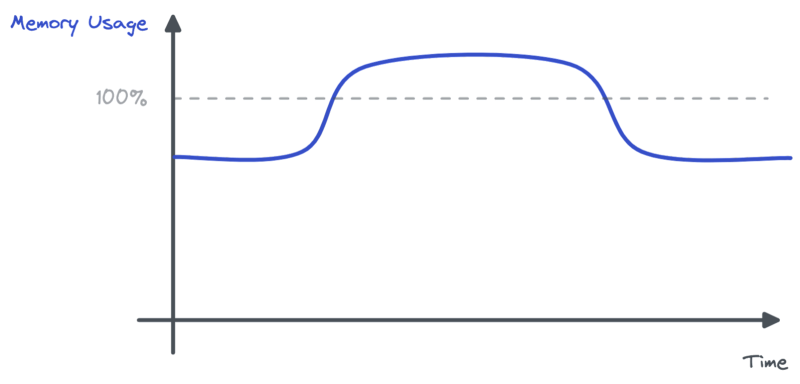
What happened? Pods had to handle twice as much traffic. The Server-Side Rendering endpoint was consuming much more memory than usual. We were making more calls to our backends to fetch data and we were rendering more pages. Backend services were struggling too. This led to more IOs and more data waiting in memory. Pods were overloaded, yet the limited metric was not CPU, but memory.
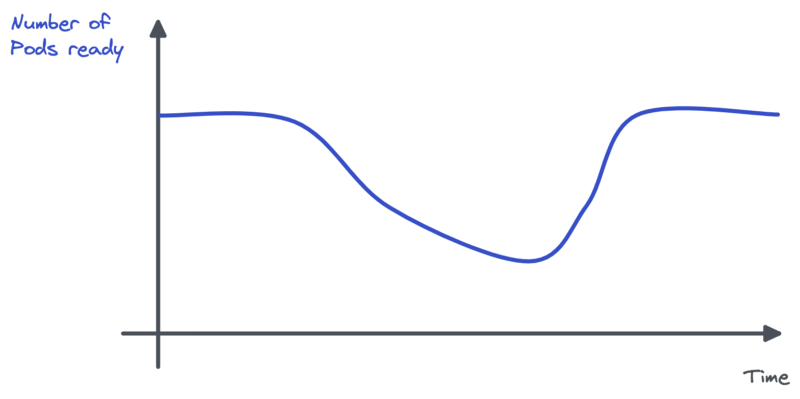
A snowball effect took place: some pods crashed with Out Of Memory errors (OOM). Because memory usage reached the config limit level, Kubernetes killed the Pods as a sanction. New pods were started but crashed too. The remaining ones were nearly in a frozen state: memory bloated but CPU not at all. This led to the HPA asking to scale down Pods: the CPU metric was indeed below the target.
We were DDOSed and had to manually scale up the Deployment.
Scaling on Memory
Important notice: this has been written before Node.js 12 and the addition of container-aware memory. Using Node.js 12 or higher, the service would not have crashed because of OOM. Instead, it would have reached the container memory limit and then seen reduced performance because of some memory swapping.
We learned the hard way that the CPU metric is not enough for our HPA. We have to read memory usage too.
Of course, memory does not reflect the Node.js server activity in a linear way. So it’s not about making the metric the principal indicator we’re using to scale up or down. But we do have to make the HPA aware of a certain limit.
Turns out it’s very easy to do with Kubernetes. We have to add another metric in the HPA config, like so:
// hpa.yml
apiVersion: autoscaling/v2beta2
kind: HorizontalPodAutoscaler
...
spec:
    ...
    metrics:
    - type: Resource
      resource:
        name: cpu
        target:
         type: Utilization
          averageUtilization: 70
    - type: Resource
      resource:
        name: memory
        target:
         type: Utilization
          averageUtilization: 85
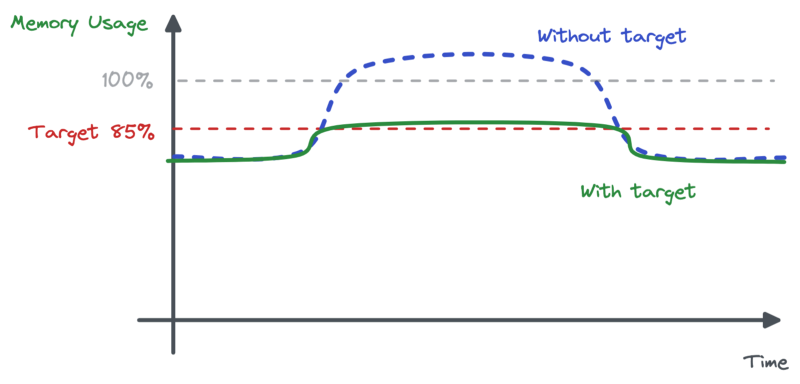
There are two ways to understand this addition. We can say we’re asking the HPA to scale up if memory usage reaches 85%. Or we can say we’re asking the HPA to not scale down if memory is over 85%. Both are valid. In our situation the second one suits the rationale quite well.
If we had this kind of memory limit in place at the time of the incident, the memory usage would never have reached the problematic level. And Pods would not have scaled down.
Better operating Node.js in Kubernetes
Writing the post mortem made the team invest more time in the infrastructure dimension of the service. We fixed our HPA, then started some background investigation on how to operate Node.js in Kubernetes better.
We first looked at how others were doing. Some are scaling on a custom Node.js metric: the Event Loop Utilization (ELU). Can we do the same? We tried but finally rolled back to the CPU/memory duo. ELU seems interesting when you have important computation off the main thread, or garbage collection impacting the CPU measurement too much. This was not our case.
Instead, we invested time in having a more robust and elastic setup. We distributed Pods on nodes with affinity and topology spread constraints to reduce the risk of seeing the Deployment impacted too much when losing a Pod.
We’re also scaling up more rapidly and with more granularity by configuring our Pods to be smaller, cleaning the assets built into our Docker image and using a distroless base Node.js image. With more Pods, but smaller ones, we are consuming nearly the same amount of resources with only a small overhead. We’ve gained in granularity as the HPA is scaling up and down.
Because it is useless to have a lot of small Pods for granularity if the container takes a lot of time to start, we have improved our procedure, going from a start-up time of 2 minutes in the worst scenario to something under 30 seconds.
We also leveraged HPA’s new behavior config to scale up as fast as possible but scale down slowly. Paired with Kubernetes’ scaling window, this prevents “flapping”, i.e. seeing the Deployment being scaled up and down continuously.
To sum up the key points of our infrastructure setup:
- We use both CPU and Memory metrics for our HPA, to scale safely
- We target small & quick-to-start Pods, for a reactive scaling
- We spread out Pods on the maximum amount of nodes possible, for robustness
Our service now consumes less resources when not needed, for example at night, but is also able to handle short and big traffic increases better. This reduced the amount of false positive alerts for the on-call person to nearly 0. More importantly, we now handle traffic changes better, improving the user experience overall.
This is backup post, primarily published on BlaBlaCar’s blog